Columbus sits right on the fall line where the hard crystalline Piedmont gives way to the softer sediments of the Coastal Plain, and that geologic boundary creates a mix of ground conditions we deal with on nearly every project. The city grew around the Chattahoochee River mills in the 1830s, and today’s redevelopment over those old industrial terraces routinely uncovers fill with brick fragments, ash, and variable silty sand that standard blow counts alone do not fully capture. A complete grain size analysis—combining mechanical sieving and hydrometer sedimentation—lets us separate the fine fraction properly, which is what drives drainage behavior, frost susceptibility, and the cutoff between silts and clays under USCS. When we work near the 1,200-acre Fort Moore impact area or along the Victory Drive commercial corridor, the gradation curve often reveals a gap-graded profile that explains differential settlement in existing slabs. For sites where the natural soil transitions from saprolitic silty sand to alluvial clay, we pair the hydrometer data with an atterberg limits determination to lock in the classification because plasticity alone can be misleading when the fines are non-cohesive rock flour from weathered schist.
On fall-line sites, the difference between an SM and an SC—two sieve fractions apart—can determine whether a footing drains freely or traps water against the stem wall.
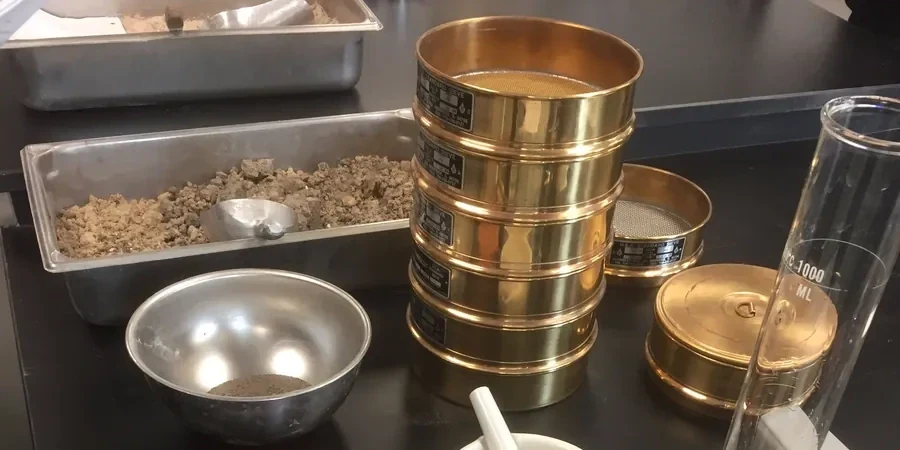
Process overview
The humidity and intense summer thunderstorms in the Chattahoochee Valley mean that soil samples here are rarely dry, and running a wash-sieve procedure on damp, iron-oxide-cemented Piedmont residuum requires careful disaggregation to avoid false coarse fractions. We follow ASTM D6913 for the sieve stack and ASTM D7928 for the hydrometer analysis, typically using sodium hexametaphosphate as the dispersant, and we report the combined curve from 75 mm down to about 0.001 mm. In the sandy loams that blanket the gentler slopes north of Macon Road, the sand fraction often exceeds 60 percent but the fines percentage can swing from 10 to 35 percent within a single boring, which completely changes the USCS group symbol from SM to SC depending on the plasticity of that minus-40 material. Across the river in Phenix City the soils are similar, but on the Columbus side the cut-and-fill terraces from mid-20th-century urban renewal have left pockets of silty gravel with trace organics that can degrade to ML or MH once remolded. What we find most useful is not just the D10–D60 range for permeability estimates but the shape of the entire curve—a flat midsection often signals a gap-graded fill, while a steep slope through the sand range points to a uniform dune-like deposit that will densify under vibration.
Local context
The most common mistake we see on Columbus projects is classifying a soil based solely on visual-manual description or a quick wash through the No. 200 sieve without running the full hydrometer. On the silty sands derived from mica schist weathering, the fines content can look low in the field but the hydrometer curve shows 15–25 percent passing 0.005 mm, which pushes the material into a borderline liquefiable category under the IBC seismic site class criteria. Another recurring problem occurs when contractors reuse on-site cut as structural fill without checking the grain size distribution—we have tested fill lifts near the Columbus Civic Center where gap-graded sand with less than 2 percent fines densified under the sheepsfoot roller but still failed a simple falling-head permeability test because the effective grain size D10 was below 0.08 mm. That kind of fill traps water behind retaining walls and softens the subgrade after the first wet season. On large pad sites in the Muscogee Technology Park area, skipping the gradation analysis also leads to over-design of underdrain systems when the soil is actually a free-draining SP, or worse, under-design when it is an impervious MH that needs a blanket drain.
FAQ
How much does a grain size analysis including hydrometer cost for a Columbus GA project on average?
For a combined sieve and hydrometer analysis per ASTM D6913 and D7928, the cost typically falls between US$90 and US$220 per sample depending on whether the sample is predominantly sand or requires extended sedimentation readings for high clay content. The price includes sample preparation, mechanical shaking, wash-sieving through the No. 200 sieve, the full hydrometer run with dispersant, and the combined gradation report with USCS classification.
When is the hydrometer portion necessary versus a plain sieve analysis?
The hydrometer is necessary whenever more than 5 percent of the sample passes the No. 200 sieve, because the silt-versus-clay split cannot be determined from sieves alone. On Columbus fall-line soils, that threshold is crossed in almost every residual and alluvial deposit we test. Without the hydrometer you cannot reliably assign a USCS group symbol like SM, SC, ML, or MH, which directly affects the design values for shear strength, compressibility, and hydraulic conductivity used in foundation and pavement design.
How do you handle samples with iron-oxide cementation common in the Piedmont residuum around Columbus?
We oven-dry the sample at 60 °C to avoid baking the iron oxides into a hard crust, then use a rubber-tipped pestle to break down the cemented lumps gently before wet-sieving. If the cemented aggregates persist, we run the wash-sieve with a dispersing agent and note the condition on the report, because forcing the disaggregation can artificially increase the fines percentage and shift the classification from a clean sand (SP) to a silty sand (SM) that does not represent the in-place behavior.